Trendemon's dashboard is your first source of information to help you better understand:
1) Total conversions for your business goals
2) The influence of content on the conversion
3) The best performing content pages for each goal, and where in the journey this article impact the most (landing, nurture, conversion).
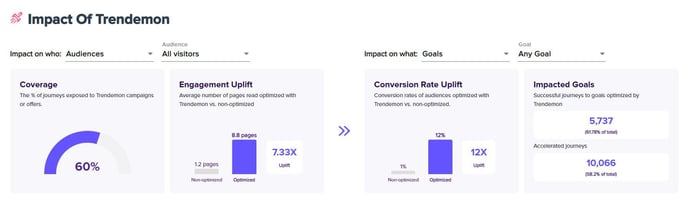
Impact of Trendemon:
The top part of the dashboard displays the uplift of Trendemon's personalization units on engagement and conversions. Click here to learn more about the metrics displayed and how you can optimize them.
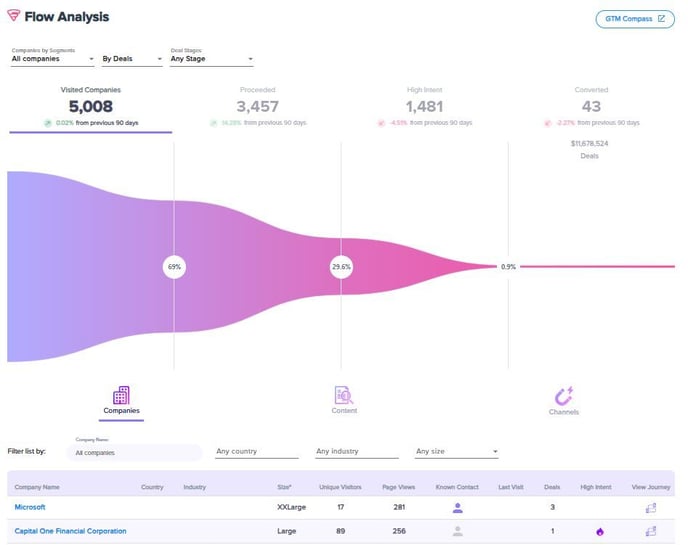
Flow Analysis:
This section on our dashboard provides a quick overview on target companies visiting your website, their engagement and conversion metrics, plus details on content and traffic channels. Click here to learn more about this section.
Audiences and Goals:
By Goal
The second part of the dashboard shows the total completion of the different goals in the selected period. you can select the goal at the right top you want to explore and see the following:
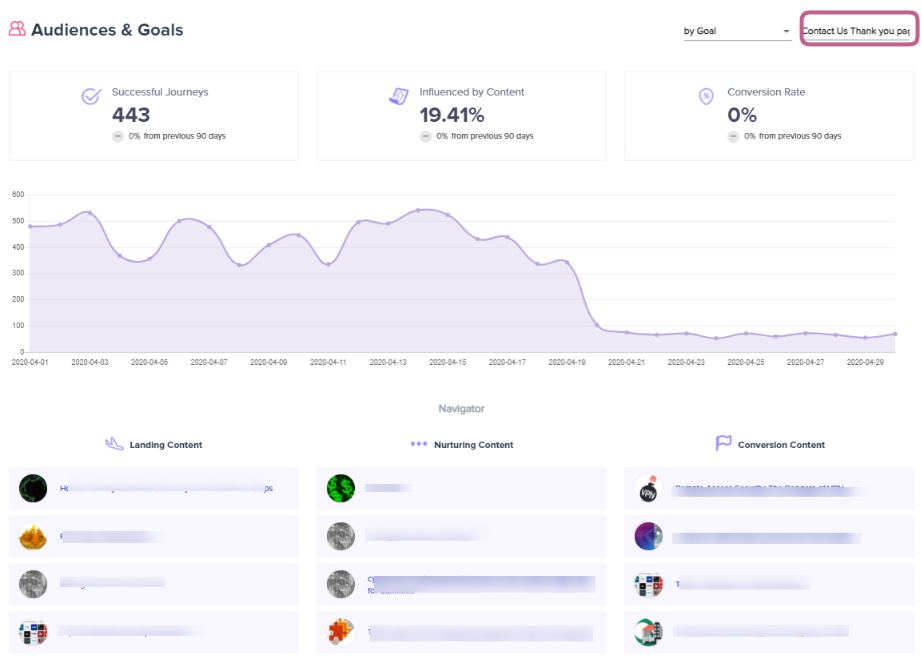
Successful Journeys - How many visitors did complete the goal.
Influenced by content - % of visitors passed through a content area in their journey.
Conversion rate - % of visitors of all visitors that completed this goal
At the bottom part of the dashboard, you can see the types of pages that were visited in successful journeys and which influenced goal conversions the most.
Landing - Visited at the beginning of most journeys.
Nurturing - Read by a returning visitor who didn't convert yet.
Conversion - Read just before the visitor converted.
By Audience
You can also present a view of the pre-defined audiences visits on your website you will be able to view their number, value, and engagement with content. (click here to learn how to set an audience)
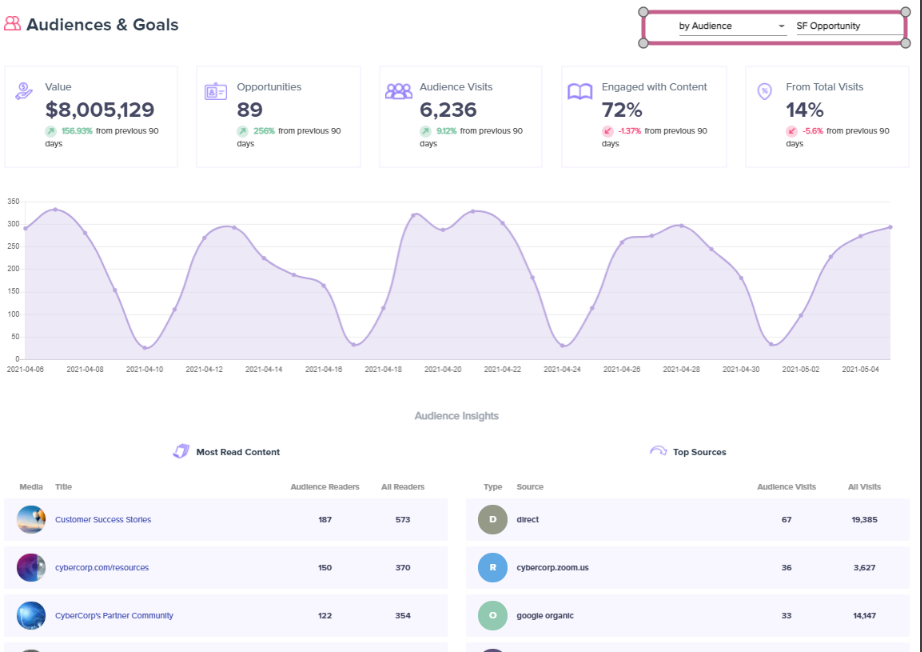
Value - (will be presented if you set integration with your CRM ) the total value of opportunities who engaged with the website
Opportunities - number of visitors, that are marked as opportunities, who visited your website
Audience visits- Number of visitors from the selected predefined group who visited your website.
Engaged with content - % of visitors passed through a content area in their journey.
Conversion rate - % of visitors of this selected group of audience, out of the total visitors.
Goals reached Accelerated - the number of goals completed in the period that had interaction with Trendemon campaigns.
Journeys Accelerated - Total user journeys that engaged with Trendemon campaigns.
Activation CTR - impression vs clicks in all Trendemon campaigns.
At the bottom part of the dashboard, you can see the most read content - the top 5 content pages were visited the most by the audience compared to all visitors. on the right side, you can find top sources - what is the original source the audience visitors came from.