How Can Trendemon Assist in the Content Creation process?
You can go in the direction of closing the content gap by using tools that assist with content gap analysis. You will analyze missing keywords, popular pages, and create missing content.
Background:
You can go in the direction of closing the content gap by using tools that assist with content gap analysis. You will analyze missing keywords, popular pages, and create missing content.
But how do you know if this newly created content is effective?
Well, to answer that question we should probably first define what is “effective.”
To us, “effective” means how many website visitors completed a predefined business goal. For example: how many visitors requested a demo (common in B2B companies), or how many visitors completed a transaction (common in B2C companies).
If you agree with this definition of “effective”, then a keyword or pageview analysis won’t cut it because there isn’t always a direct correlation between the two.
And so, to initiate an effective analysis, there’s a need to investigate the direct correlation between visitor behavior on the website (or within Marketing Automation channels) and the completed business goal. Or, in other words:
- What did the users that requested a demo do/read on my website prior to requesting a demo?
- What did my Marketo/Hubspot/Pardot MQLs do/read on my website before becoming MQLs?
Furthermore, if we want to be even more accurate, then we need to investigate a journey and not a single session. In other words, we need to investigate what did the visitors/leads do/read not just on their last session, but throughout their journey (past 1, 3, 6, or 12 months), prior to completing the business goal.
And so, if we go back to our original question: what topics should I write about, then we can use Trenגemon to discover which articles visitors engaged with the most before converting to a business goal - those are the topics we should focus on.
Where is this analysis on the Trendemon Dashboard:
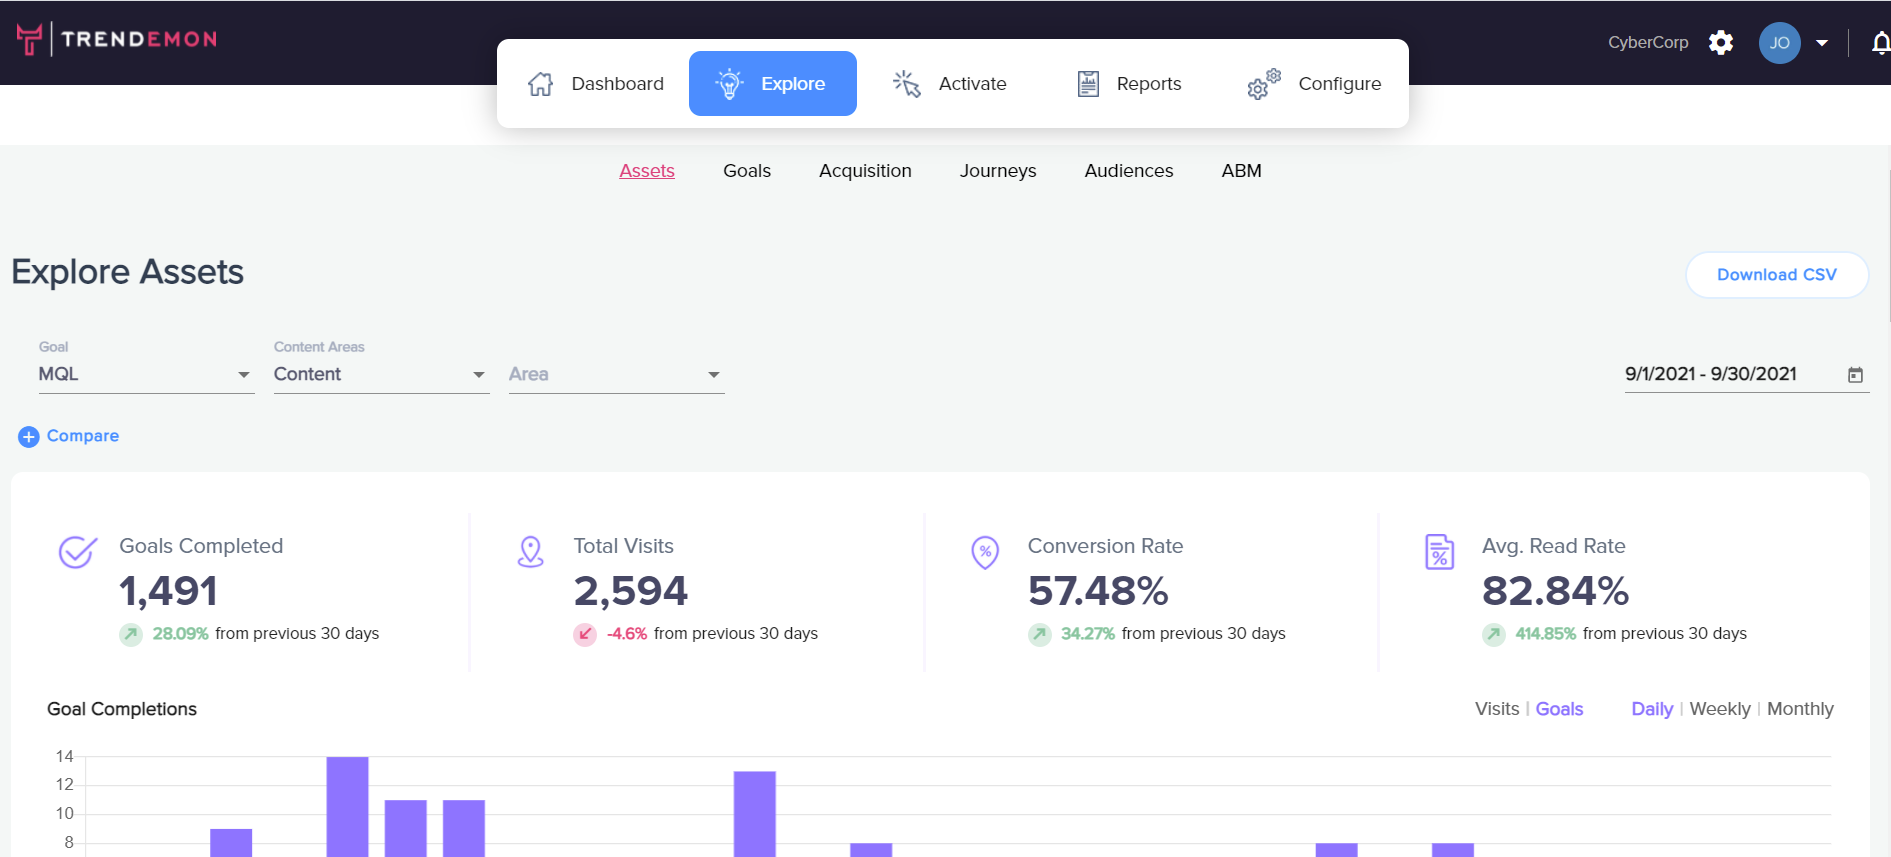
Under Explore > Assets, we select the relevant business goal (in the example below: MQL), and relevant time frame:

Note that you can also select a specific website area to see how content from a particular area impacted the business goal.
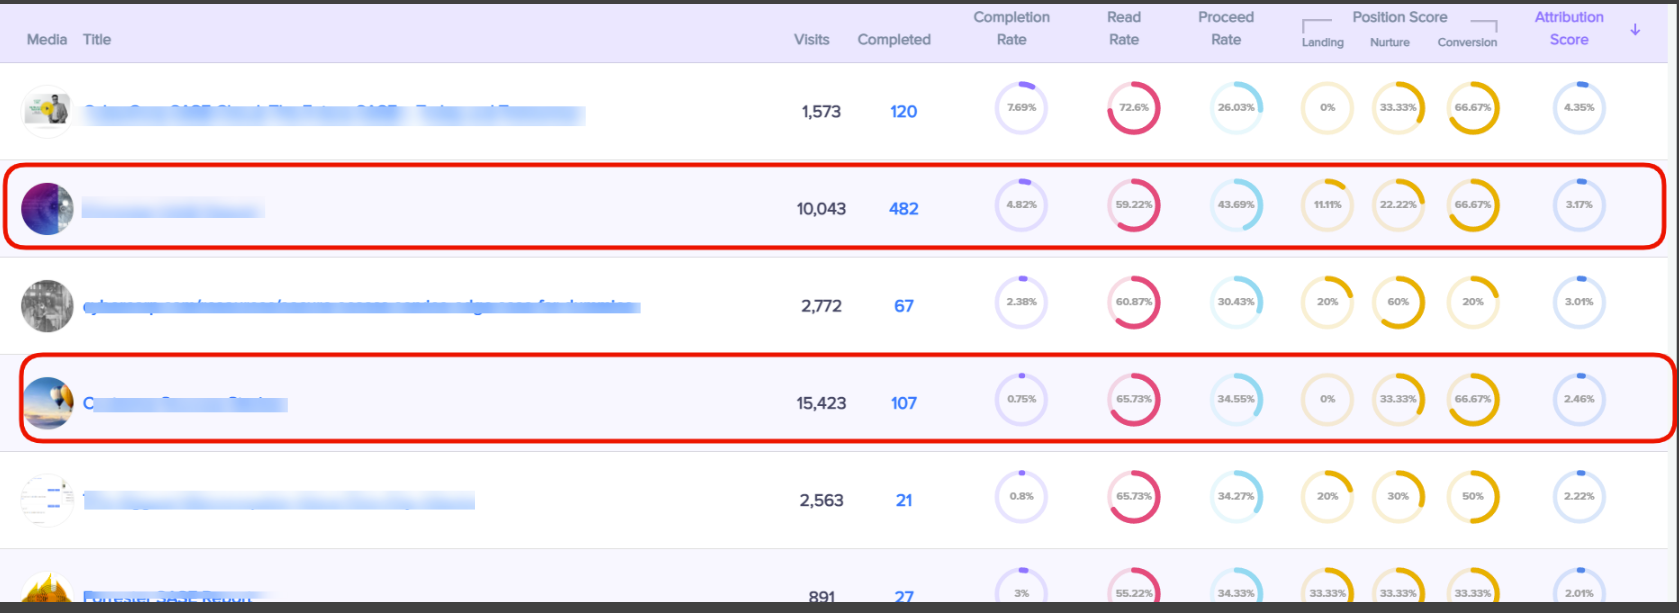
You will then get a list of posts and how they impacted the business goal we selected:

Take a look at the two circled examples above.
In the top example, there are fewer visitors to the post than the bottom one.
And yet, the Completion Ratio (the number of people who eventually completed the goal divided by the number of visitors to that page) is more than double. This means that in terms of business impact, the top post was more effective.
Even in terms of engagement, it seems that the top post was better:
Although the Read Ratio (percentage of visitors to that page that actually read the page) of the bottom post was higher than the top post, the Proceed Ratio (number of visitors to that page that continued to another page on the website) is lower on the bottom post. it allows you to identify how many visitors left the website after reading that post, as it goes down, it is reflecting that content is less engaging.
You can also export the information by using the download CSV

For any questions about this, please don’t hesitate to contact our
Customer Success team at support@trendemon.com